If you would like to participate please contact us. Donations to the general fund to support those who cannot afford the cost of the test are welcome.
DNA STUDY


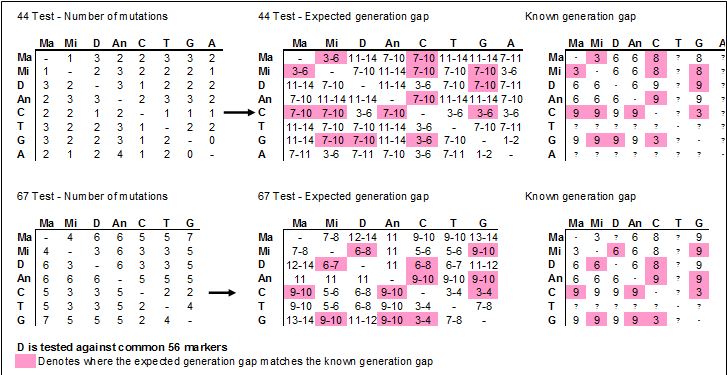
Actual gaps versus predicted gaps
We have compared the results of 8 persons in the Y-DNA study. This analysis compares the results expected generation gap with the actual generation gap. Where the actual generation gap is not known, we predict the gap using expected mathematics. Where only the 67 marker test has been taken, we have used the standard 44 marker suite to replicate the results for this test using the 67 marker results.
There are three section/columns of data
1) On the left, the actual number of mutations between individuals
2) The expected generation gap, which is based on the actual number of mutations and is a mathematical calculation. A forecasting table is shown in Appendix B
3) On the right, the known generation gap.
The values in pink show where the predicted gap matches the known gap. So as an example, the between M and M2, there is 1 mutation in 44 markers. The predicted generation gap is 3-6 generation, and the known gap is 3 generations. The theory matches the known difference. With the 67 marker test however there are 3 additional mutations which predict a gap of 7-8 generations, which is longer than the known difference of 3 generations. This increased variance is more likely to occur where a number of faster mutating markers are included in tests, such as the additional 23 markers in the 67 marker test compared to the 44 marker test, and it therefore becomes more likely to see sometimes unusual results.
Whilst the odd aberration will exist, it is interesting to see overall the accuracy of the mathematical model behind the predictions does correctly predict the generation gap the majority of the time. Compare this however to many online modelling tools, the predicted generation gap rarely matches as these sites often use the old ‘Walsh’ data and do not use up to date values of mutation rates.
This exercise also shows the inconsistencies in individual tests as Ma and Mi are the same distance from D, yet the prediction of the generation gap between Ma & D is forecast at 12-14 generations whereas between Mi and D is 6-7 generations. Mi is the same distance from 'An' and from D, yet the forecast gap between Mi and D is 6-7 generations (the known gap is 6), and the forecast gap between Mi and 'An' is 11 generations. This is purely due to extra random mutations, but does throw out the calculation. 'An' and G have the same mutation on DYS724b although this is coincidence as we know that they have occurred independent of each other, and this result masks two extra mutations.